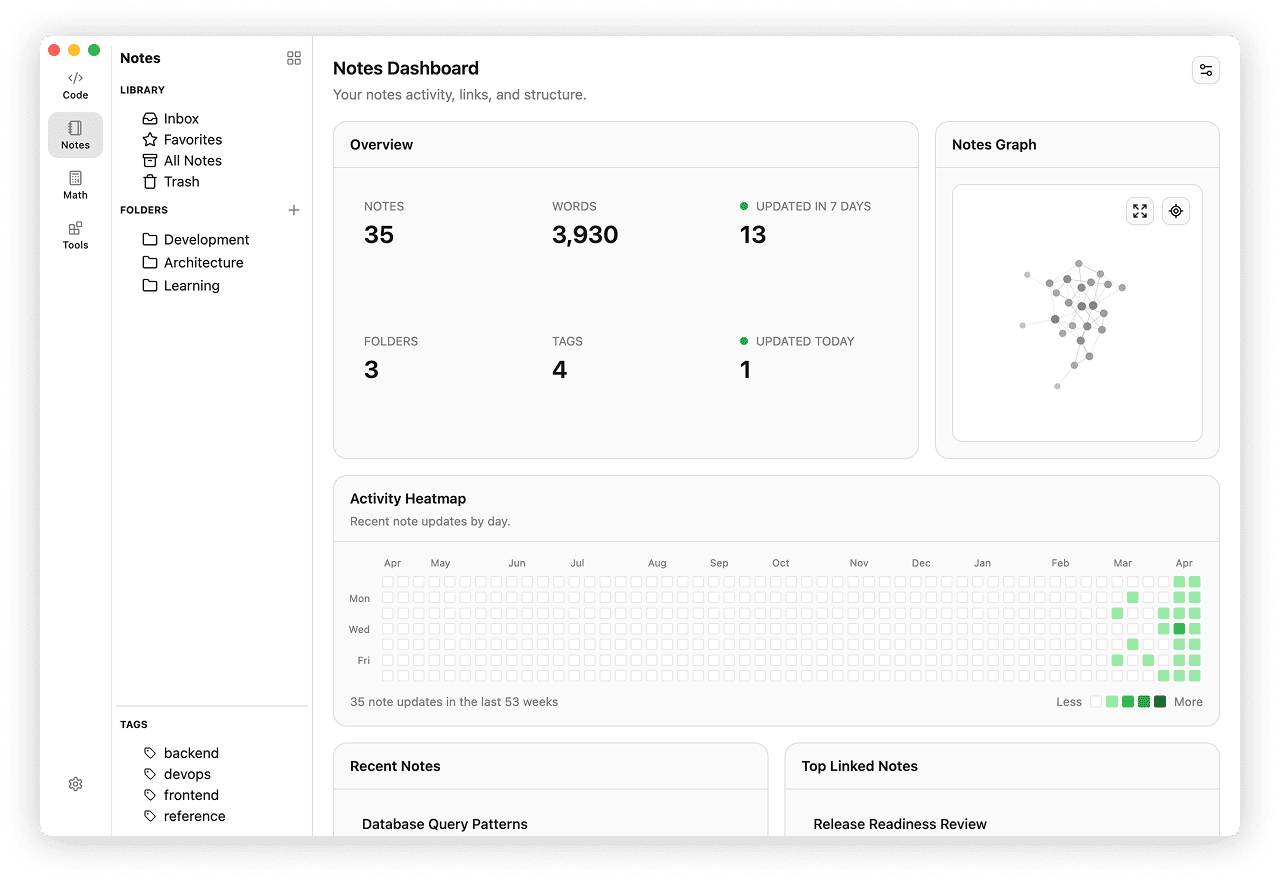
Dashboard
Dashboard is the home screen for Notes. Use it to get an overview of your note base before opening a specific note.
Opening Dashboard
- Open the Notes space.
- Click the Dashboard button with the grid icon in the Notes sidebar header.
Dashboard replaces the note list and editor area, while the Notes sidebar stays visible.
What Dashboard Shows
Overview
The overview block summarizes your current note base:
- Total notes
- Total words
- Folders
- Tags
- Notes updated today
- Notes updated in the last 7 days
Activity Heatmap
The heatmap shows activity over the past year.
- One cell represents one day
- Darker cells mean more notes were updated on that date
- Hover a filled cell to see the date and update count
Recent Notes
Recent Notes lists the latest updated notes, together with the folder name and update date.
Click any note to open it in the regular Notes workspace.
Top Linked Notes
Top Linked Notes highlights notes with the highest number of incoming internal links.
Use it to find hub notes and heavily referenced pages in your knowledge base.
Notes Graph Preview
The graph preview shows a compact visual map of note connections.
- Click a node to open that note in Notes
- Use the reset button to recenter the preview
- Use the expand button to open the full Notes Graph
Customizing Widgets
Click the settings button in the dashboard header to choose which widgets stay visible.
- Overview
- Activity Heatmap
- Recent Notes
- Notes Graph
- Top Linked Notes
If you hide everything, Dashboard shows an empty state until you turn widgets back on. Use Show All Widgets to restore the default layout.
Full Notes Graph
The full Notes Graph opens from the graph preview.
- Drag to pan
- Use the mouse wheel or graph controls to zoom
- Hover a node to inspect its neighborhood
- Click a node to open the note in the main Notes workspace
- Use Back to Dashboard to return
The graph is useful for exploring how notes connect through internal links. For link syntax and navigation, see Internal Links.